
SEO reporting dashboards: Complete guide + examples for 2026
SEO agencies choose Assembly
Embed your SEO dashboards inside a branded client portal where clients can review reports, share files, and manage billing in one place. Try for free
4.9 rating
- What is an SEO reporting dashboard?
- What should I include in an SEO reporting dashboard?
- Examples of SEO reporting dashboards
- How to create an SEO reporting dashboard in Looker Studio
- 5 Top SEO reporting dashboard tools for 2026
- Benefits of SEO reporting dashboards
- Limitations of SEO reporting dashboards
- Want to consolidate your SEO dashboards for clients? Try Assembly
- Frequently asked questions
After analyzing how top agencies structure their SEO reporting dashboards, here are the key metrics to include, how to build one, and examples and tools to use in 2026.
What is an SEO reporting dashboard?
A search engine optimization (SEO) reporting dashboard is a visual summary of your organic search performance. It brings traffic, rankings, and conversions into one place so you can see what’s working.
The challenge is that SEO data makes sense to the people working in it daily, but not always to the clients paying for it. A dashboard bridges that gap by translating raw numbers into a clear picture of what's working, what isn't, and where results are coming from.
What should I include in an SEO reporting dashboard?
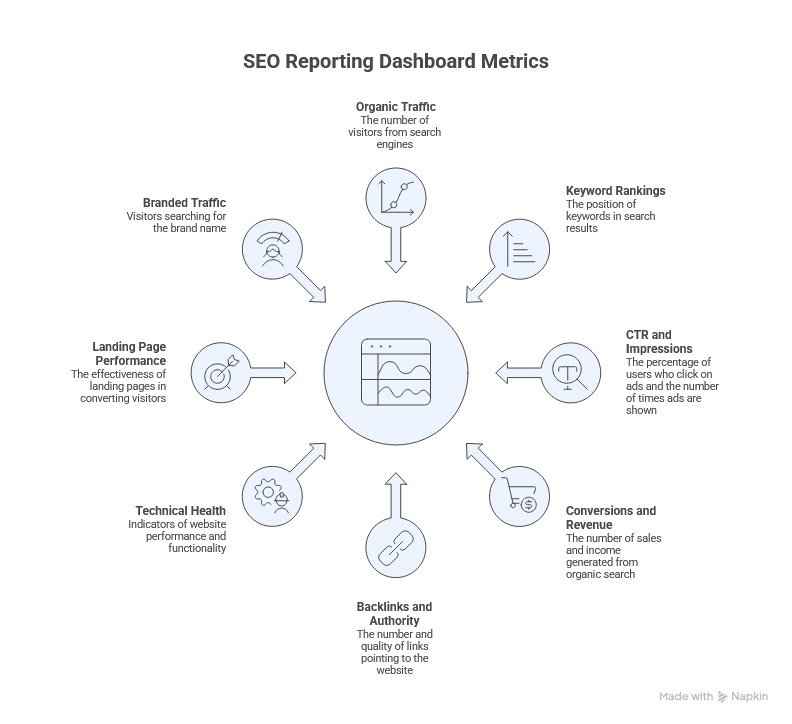
An SEO reporting dashboard should include the metrics that connect organic search activity to business outcomes. The exact mix depends on your goals, but there’s a core set worth building around for most sites and audiences.
Here are the metrics to prioritize:
- Organic traffic and traffic trends: The total volume of visitors arriving from search, tracked over time. A single week of data doesn’t tell you much on its own, but several months of directional movement give you a clearer sense of whether performance is improving or declining.
- Keyword rankings and visibility: Where your target pages rank for the keywords they're optimized for. I’d recommend tracking this alongside traffic because rankings don’t always move in sync with clicks. That gap can sometimes point to title tag or meta description issues before you revisit the content itself.
- Click-through rate (CTR) and impressions: Impressions show how often your pages appear in search results. CTR shows how often people click your listing after seeing it in search. A high impression count with a low CTR means the page is showing up but not earning clicks. That often points to title tags or meta descriptions that need improvement.
- Conversions and revenue from organic search: Traffic on its own doesn't tell the full story. Clean conversion tracking ties organic visits to form fills, signups, or purchases, so you can see how SEO contributes to revenue.
- Backlinks and authority signals: Backlinks measure the volume and quality of sites linking to your domain. You don’t need to review this weekly, but a sudden drop or spike can help explain ranking shifts that don’t have an obvious on-page cause.
- Technical health indicators: Crawl errors, page speed issues, indexing problems, and Core Web Vitals. These don’t measure SEO performance directly, but they can help identify issues that may be affecting results.
- Landing page and content performance: Which pages drive the most organic traffic, and how those pages perform against each other. This helps you prioritize your optimization efforts.
- Branded vs. non-branded traffic: Branded traffic reflects people already searching for you by name. Non-branded traffic reflects your reach to people who don't know you yet. Separating the two provides a clearer picture of SEO-driven growth.
Examples of SEO reporting dashboards
SEO dashboards aren't one-size-fits-all. The metrics you surface depend on what you're trying to monitor and who's reading the data. Here are two common examples:
SEO audit dashboard
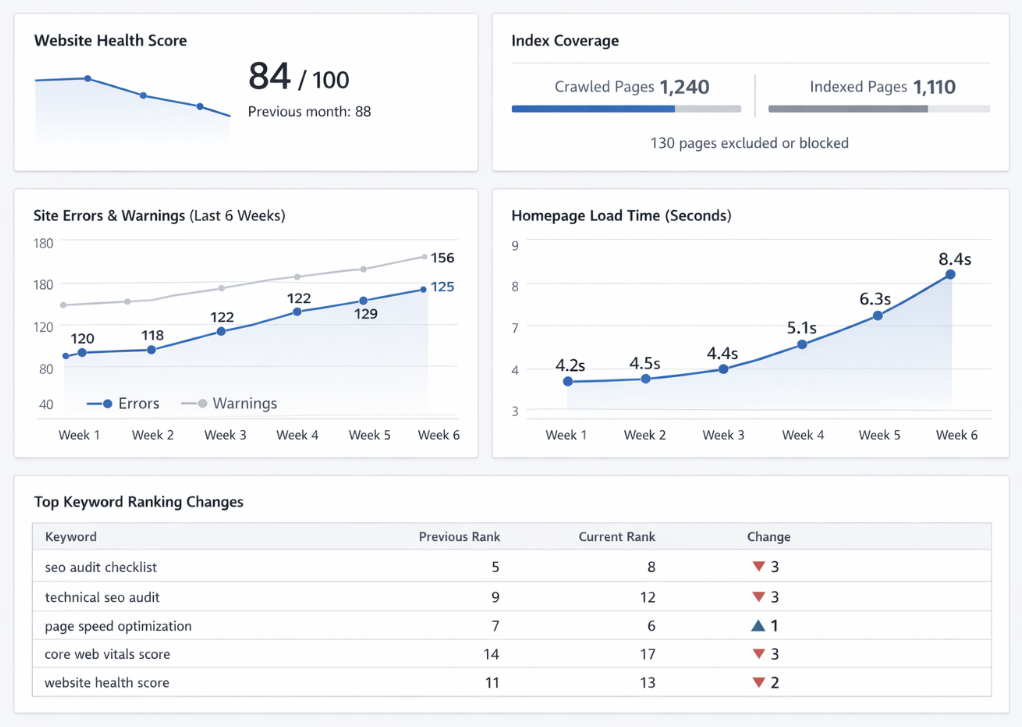
An SEO audit dashboard tracks the technical health of a website. It typically surfaces crawl errors, indexing issues, page speed scores, broken links, and Core Web Vitals. SEO managers use it to catch issues like indexing or speed problems that could hurt search rankings if left unresolved.
This type of dashboard is typically reviewed more frequently because technical issues can surface quickly and affect rankings.
SEO KPI dashboard
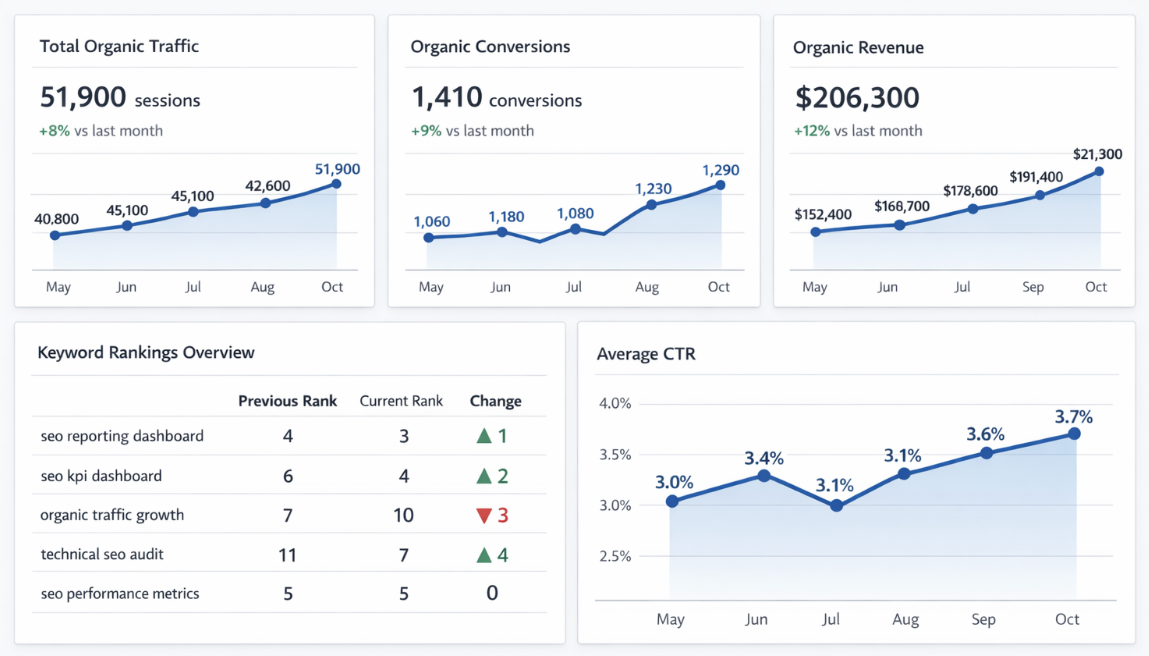
An SEO KPI dashboard focuses on organic performance outcomes. It tracks metrics like organic traffic, keyword rankings, click-through rate, conversions from organic search, and revenue attributed to organic.
This is the dashboard most clients see because it ties SEO work directly to business results, which makes it central to client reporting.
How to create an SEO reporting dashboard in Looker Studio
Building an SEO reporting dashboard doesn't require technical expertise or expensive tools. Here's how to do it in 6 steps:
1. Get access to Google Search Console and Analytics
Ask your client to open Google Search Console (GSC), navigate to Settings, and click "Users and permissions." From there, they can add your email and assign you full permissions.
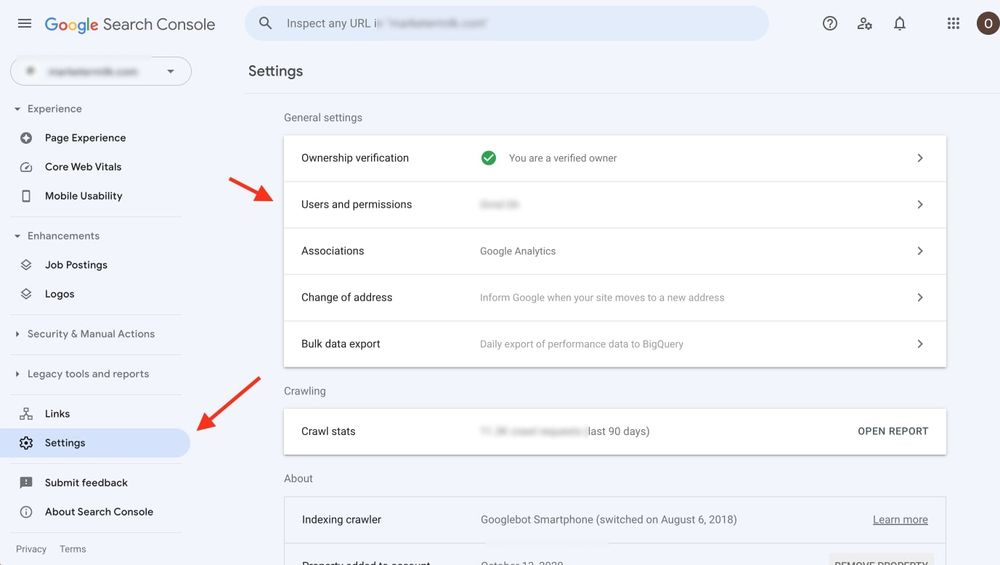
Google Analytics (GA) access is also worth requesting at the same time. Ask your client to add your email in GA with the same process as GSC.
Tip: Clients at larger companies may create a dedicated company email for you rather than adding your personal address. Either works, just confirm which access level you'll receive before getting started.
2. Use a Looker Studio template
Once you have access, you're ready to build. There are paid tools that can help with this, but you can start with the free version of Looker Studio. It connects directly to GSC and works well for client reporting.
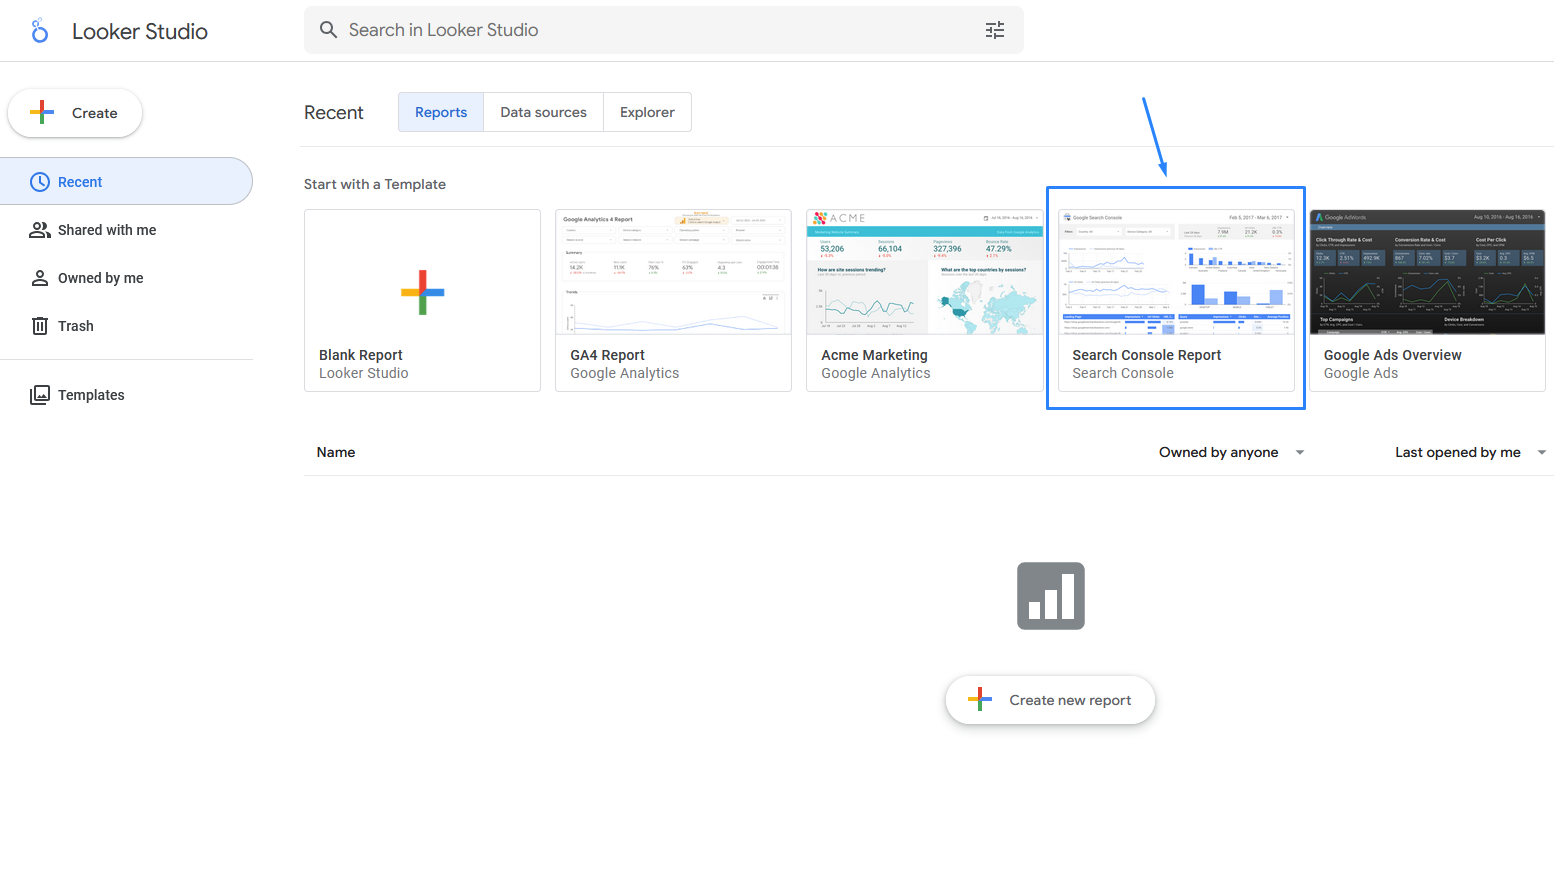
Go to Looker Studio and open a new project. From the template gallery, select the "Search Console Report" template. It comes pre-loaded with placeholder data and covers the core metrics you'll need as a starting point.
3. Integrate your data
Click "Use my own data" in the top right corner. You'll see two data properties to connect.
Here's what each one pulls in:
- Site data: Keyword position, CTR metrics, and site impressions
- URL data: Landing page performance, URL clicks, URL CTR, and impressions
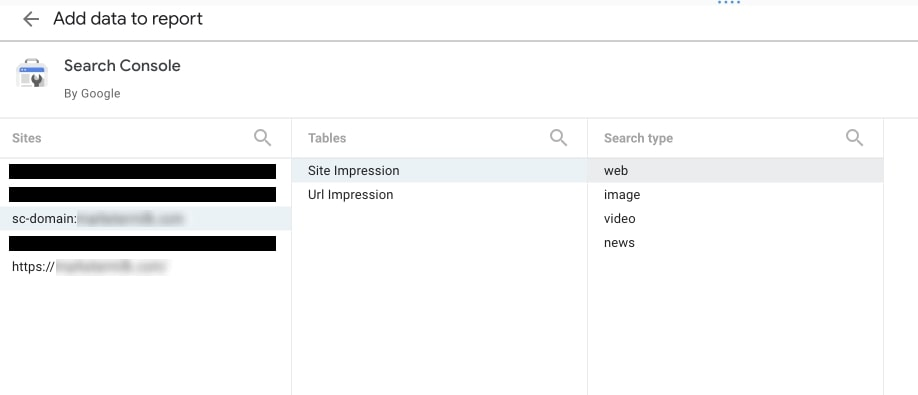
Connect site data first. Select your GSC property, choose "Site Impression," then "Web," and click Add. Repeat the process for URL data, selecting "URL Impression" this time.
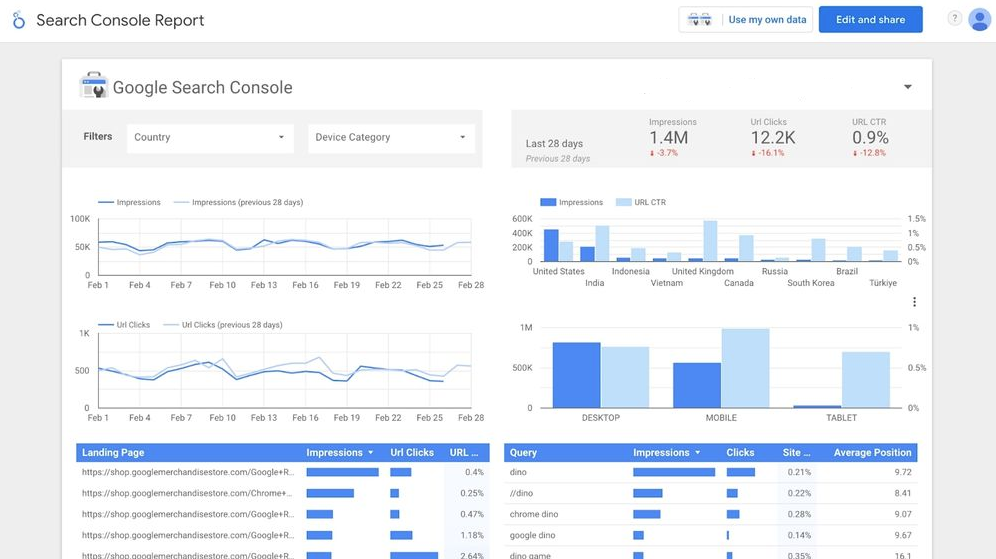
Now, you should have your data accurately reflected in your SEO dashboard. I intentionally blurred out sensitive data, but you get the point.
Tip: If your GSC account has been active for a few years, your site may appear twice in the list. Use the version prefixed with "sc-domain" if it appears, as it tends to provide more complete data.
4. Create pages for separate web properties
Click "Edit" in the top right corner of your dashboard, then right-click "Page 1" and select "Duplicate." This carries over your existing charts and layout to the new page.
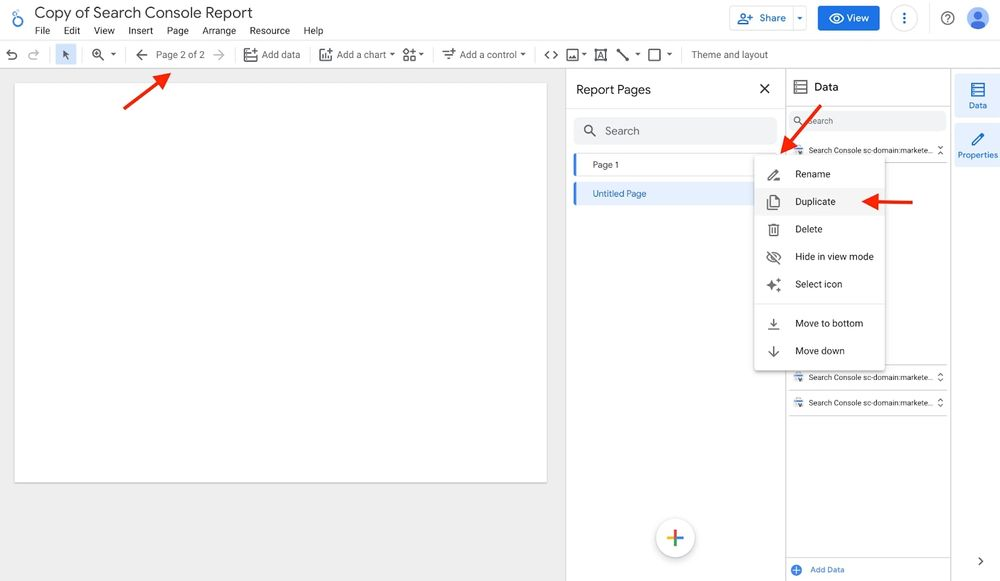
From there, click on any chart and scroll to "Add a filter" in the sidebar. To isolate blog content, create a landing page filter that includes only URLs containing "/blog." To show non-branded traffic, create a query filter that excludes your brand name and its common variations.
Filters save automatically, so you won't need to recreate them for each chart on that page. Repeat this process for each web property you want to track separately.
5. Customize your template for each client
Click "Theme and layout" to adjust colors, fonts, and chart styles to match your client's brand. Add their logo to the top of the report and rename each page to reflect their site structure.
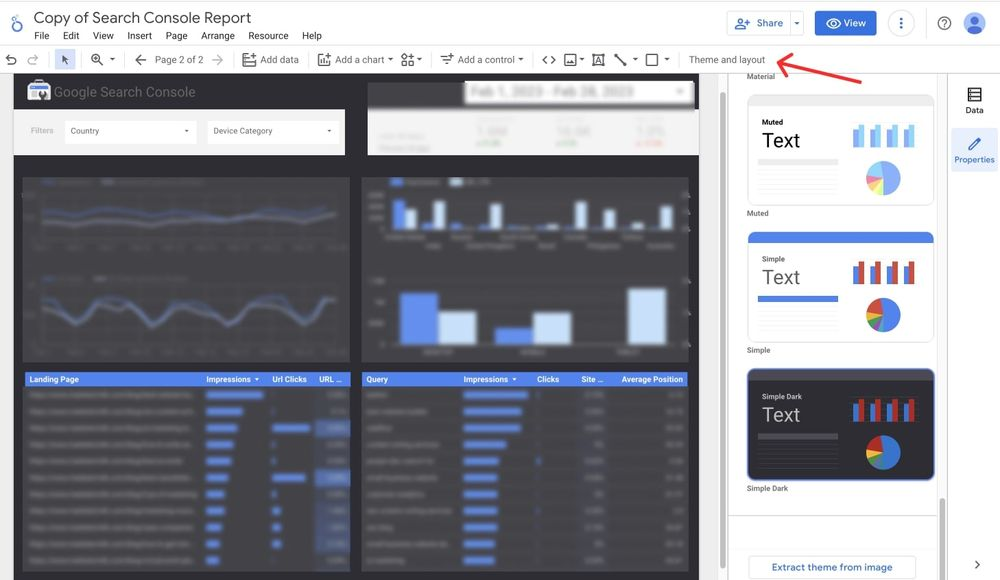
A branded dashboard signals that the reporting was built specifically for that client. It's a small detail that tends to make a visible difference in how the work is perceived.
You can also take things a step further and embed your dashboards into a white-labeled portal to give your clients a full experience.
6. Embed your dashboard in a client portal (optional)
Sharing a Looker Studio link works fine on its own, but a client portal gives clients one place to access reports, contracts, invoices, files, and project updates without juggling separate tools.
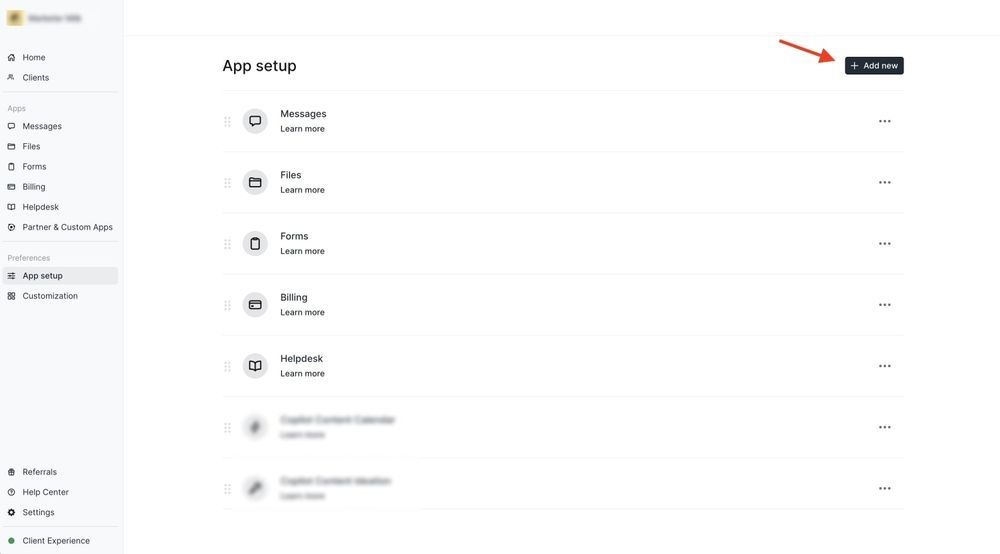
Assembly supports dashboard embedding from Looker Studio, Databox, and other major reporting tools. To set it up, log into your Assembly account.
In your dashboard, navigate to the App Setup section, click "Add new," and add the Looker Studio app.
Then, go back to your Search Console Report in GSC and click the dropdown next to "Share." Select "Embed report," and copy the embed code.
Once you paste the code in Assembly, your client will be able to access their SEO reporting dashboard straight from their own portal.
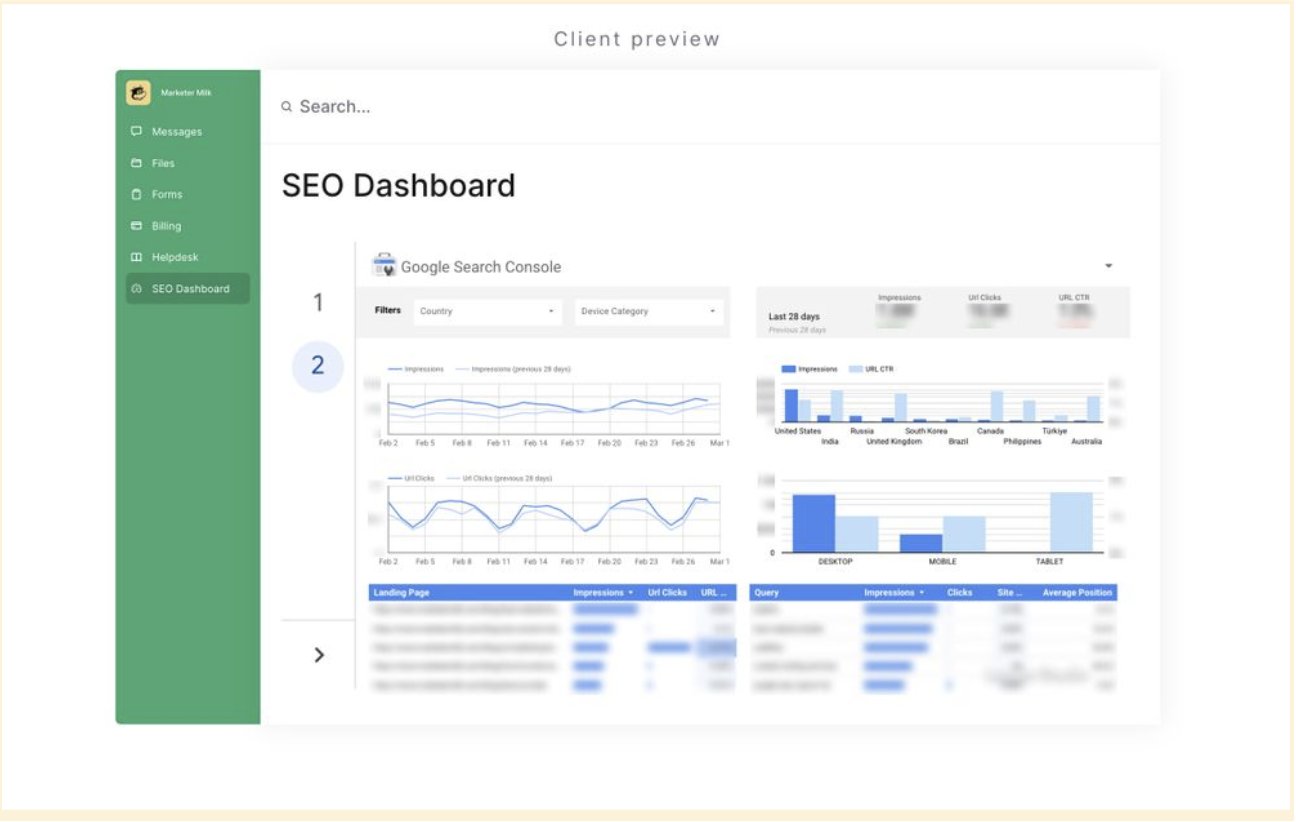
As you can see, your client will now have a tab called “SEO Dashboard” (or whatever you named yours). When they click on it, they’ll be able to see all the pages on the reporting dashboard you made.
Now you have clean SEO reporting dashboards that your client can check each time they log in to their client portal.
5 Top SEO reporting dashboard tools for 2026
Some SEO reporting tools build and automate the dashboard itself, while others provide a structured place for clients to access it. Many SEO pros use both.
Here are 5 tools worth considering:
- AgencyAnalytics is a client reporting platform built for marketing agencies. It pulls data from Google Analytics, Search Console, Ahrefs, and Semrush into white-labeled dashboards you can share directly with clients. The templates can feel limiting if your reporting requires more advanced customization.
- Google Looker Studio is a free data visualization tool for building fully custom dashboards. It connects to Google Analytics, Search Console, and third-party sources through connectors. It works well for fully custom builds, but it requires more setup if you need something ready quickly.
- DashThis is a marketing reporting tool for agencies that need clean, shareable client reports fast. It covers SEO, PPC, and social data through dozens of native integrations, but it may be limited if your clients expect more advanced or highly customized data breakdowns.
- Databox is a KPI dashboard tool that pulls data from your marketing, CRM, and analytics platforms into a single view. It’s often used for internal performance tracking rather than highly branded client deliverables.
- Assembly is a client portal platform where you can embed SEO dashboards from Looker Studio, Databox, and other major providers directly into your client's workspace. Clients log into a branded portal and access reporting alongside projects, files, and communication, rather than receiving a standalone dashboard link.
Benefits of SEO reporting dashboards
SEO data often lives across spreadsheets, analytics tools, and slide decks. A reporting dashboard pulls those metrics into one structured view so performance discussions stay focused on outcomes instead of scattered numbers. Here are some common benefits of these dashboards:
Clearer client communication
Clients who have access to a structured dashboard can review performance ahead of a call, creating more shared context for the discussion. This reduces repetitive clarification and keeps conversations focused on decisions.
Faster identification of what needs attention
Rather than rebuilding a status update from scratch each week, you can scan the dashboard and quickly see whether something requires attention. That makes reporting more efficient and allows you to respond to performance changes sooner.
Better alignment across stakeholders
A shared dashboard gives leadership, account managers, and marketers a common reference point. When everyone looks at the same data, conversations tend to shift from debating numbers to deciding next steps.
More deliberate prioritization
When metrics are tied to defined goals, it's harder to get distracted by surface-level activity. Vanity metrics like impressions or raw traffic numbers can pull focus away from what drives revenue. I've seen dashboards help teams stay anchored to the data that matters.
Limitations of SEO reporting dashboards
SEO reporting dashboards improve visibility, but they can't resolve weak data, unclear goals, or gaps in strategy. Here are some common limitations of these dashboards:
- They show what happened, but not why: A drop in organic traffic will show up clearly. The cause, whether that's an algorithm update, a competitor gaining ground, or a technical issue, won't show up the same way. I find that diagnosis still requires human judgment and investigation outside the dashboard.
- Visibility can create a false sense of control: Stakeholders sometimes treat a clean, well-organized dashboard as evidence that performance is under control. A dashboard reflects data, but it doesn't tell you whether the underlying strategy is working.
- SEO attribution is inherently incomplete: Some conversions touch multiple channels before closing, and some ranking gains take months to show traffic impact. No dashboard fully resolves that ambiguity, and presenting one as though it does can lead to misleading conclusions.
- Real-time data can prompt over-reaction: Checking rankings daily or watching traffic fluctuate week to week can create unnecessary anxiety. Teams can misread normal variation as a problem and make changes that aren't warranted yet. I'd recommend setting a cadence for when you actually review data rather than checking it constantly.
Want to consolidate your SEO dashboards for clients? Try Assembly
The right platform can help you present your dashboards in a structured, professional way while keeping reporting and client communication organized in one place.
Assembly is a client portal software tool built on a core CRM with project management, messaging, and file sharing. Service businesses use it to create a branded space where clients access project updates, documents, embedded SEO dashboards, and communication in one place.
Here’s what you can do with Assembly:
- Embed a custom dashboard or analytics platform: Assembly lets you embed custom-built dashboards from Looker Studio, Databox, and any major service provider that offers embedding, as well as create custom dashboard apps specific to your business.
- Track client details and activity: Manage client records, communication history, and relationship data in a structured CRM that keeps everything organized in one place.
- Give clients a branded portal: Clients log into a space that reflects your brand to access contracts, invoices, files, and project updates without email back-and-forth.
- Keep tasks, messages, and files together: Client communication, shared files, and project tasks stay connected to each client record instead of being scattered across separate tools.
- Prep faster for meetings: The AI Assistant summarizes recent client activity and communication, helping you walk into calls with a clear picture of what’s been discussed and what’s outstanding.
- Cut down on admin: The Assistant helps draft messages, invoices, and tasks for your team to review, reducing the time spent setting up follow-ups and documentation.
Ready to give clients a more organized experience? Start your free Assembly trial today.
Frequently asked questions
What is the difference between an SEO dashboard and an SEO report?
An SEO dashboard is a live, continuously updated view of performance data, while an SEO report is a static summary shared weekly or monthly. A dashboard pulls real-time metrics like traffic, rankings, and conversions into one place so you can monitor progress at any time. A report usually highlights key insights and context for a specific period.
Should executives see the same dashboard as marketers?
No, executives should see a simplified view focused on revenue, growth trends, and high-level performance. Marketers need deeper metrics like keyword movement, landing page performance, and technical issues to guide daily work. Tailoring views helps each group focus on decisions that matter to them.
Can I build an SEO dashboard without technical skills?
Yes, you can build an SEO dashboard without technical skills by using tools with templates and drag-and-drop builders. Platforms like Looker Studio and Databox let you connect data sources and customize charts visually.
Your clients deserve better.
Try for free for 14 days, no credit card required.